Your bond book is spread across the curve and the desk wants to know what happens if it steepens. Duration is the number you have. It is not the number that answers the question.
Duration measures sensitivity to a parallel shift - the whole curve moving up or down together. A steepening is not that. When the long end sells off while the short end holds, or vice versa, duration gives you one number for a move it was not built to describe. The loading table separates them.
The three factors
Treasury Portfolio runs PCA across eleven maturities from one month to thirty years. The algorithm does not know what it is looking for; it finds the patterns in how those maturities have moved together over the history you select. Three factors account for the majority of what has happened to the curve.
The first factor is level. When it moves, the whole curve shifts - every maturity in the same direction. This is the move duration captures.
The second is slope. Short maturities and long maturities move in opposite directions. The curve tilts. A steepening is a slope move. A flattening is a slope move. Duration does not distinguish between them.
The third is curvature. The middle of the curve moves relative to the wings - the belly rises or falls while the two- and thirty-year points stay roughly in place. It is a smaller driver on most days, but it is not zero, and for books concentrated at the five- to ten-year part of the curve it is not ignorable.
Every real move the curve makes is some combination of all three. The factors simply name which kind of movement you are looking at.
The loading table
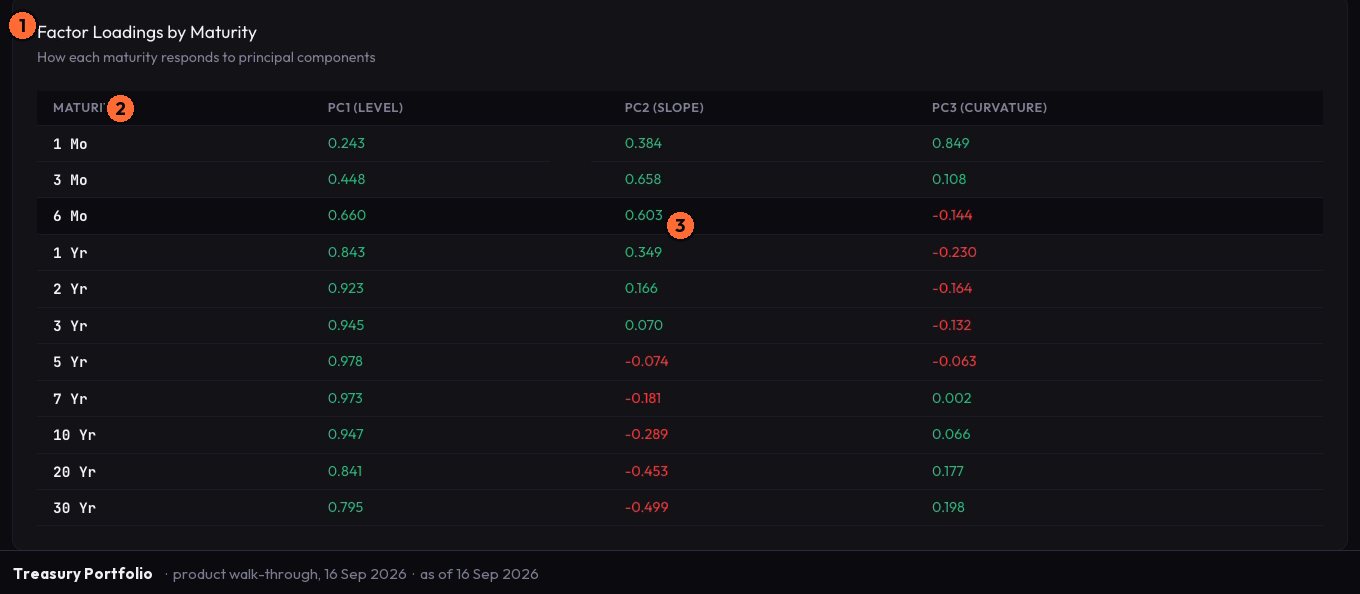
The surface produces one table: eleven rows, one per maturity, and three columns, one per factor. Each cell holds a number. That number is the loading - how much this maturity moves, historically, when this factor shifts by one unit.
You read the table by maturity first. Find the row for each tenor you actually hold. Then read across the three factor columns. A high loading on slope at the ten-year point means your ten-year exposure has moved substantially with steepening and flattening cycles over the history you selected. A loading near zero on curvature at that same row means belly moves have done relatively little to it.
The table translates "where is my book on the curve?" into "how does my book decompose across the three kinds of curve movement?" Duration is one answer to one of those three columns. The table gives you all three.
A worked example
Say you are looking at a synthetic book - call it a model portfolio for illustration - with most of its weight at the ten-year maturity and a smaller position at the two-year. Say the loading table shows the ten-year carrying a high slope loading and the two-year carrying one that is substantially smaller in magnitude but with the opposite sign. In that case a steepening - a positive slope factor move - hits the ten-year and the two-year in opposite directions. The position is not a simple short-duration or long-duration bet; it is a curve position, and duration alone would not have told you that. That is what the table adds: the decomposition that makes a steepening and a parallel shift into distinct numbers rather than the same number viewed differently.
What the surface cannot tell you
Treasury Portfolio reads the US Treasury curve. It does not read corporate spreads, EM sovereign curves or agency paper. If your book includes those, the factors here describe a reference curve, not your actual exposure.
The factors are estimated from historical covariance across the history you choose. Estimate on one year and you get a picture of recent curve behaviour. Estimate on ten years and you get a longer-regime picture that includes rate cycles the one-year window excludes. Neither is the correct choice by default - the right choice is the horizon your risk framework operates against. If the rate regime shifts materially, the factor structure will shift with it, and loadings estimated in one regime may not describe the next one cleanly.
The surface names the exposure. It does not tell you what to do with it. That decision is the desk's.
Starting point
Open Treasury Portfolio, choose the history length you manage against, and read the loadings for your largest maturity across all three factors.