What roughness means, in plain terms
Price does not move with uniform texture. Some periods are smooth: moves trend cleanly, candles stack in one direction, the path is easy to follow. Other periods are rough: the same instrument whipsaws inside a tight range, reversals happen inside reversals, and nothing resolves. The difference between those two states is measurable.
The engine underneath Multifractal Analytics computes the local Hölder exponent - a number from fractal geometry that describes how jagged price movement is at any given moment. A high exponent means smooth, persistent behaviour. A low exponent means rough, spiky, hard-to-follow behaviour. The transition between the two tends to appear in the exponent before it becomes visible on a standard price chart.
The framework is not native to finance. It comes from the study of turbulence - aerodynamic roughness in fluid systems, which is the domain of the founder's PhD work. Applied to markets, it treats price as a signal with variable roughness rather than a simple series of returns. That origin matters: a framework built outside finance cannot have been fitted to historical market data, which is the usual mechanism by which quantitative tools overfit.
Multifractal Analytics runs three sub-tools. They answer three separate questions.
Regime Radar - is price behaving smoothly or roughly right now?
Regime Radar reads the current texture of price movement. It is not asking where price is going. It is asking what kind of market this is at this moment - one in which a smooth, directional read is plausible, or one in which roughness has taken over and directional reads carry more uncertainty.
The surface is configurable: ticker, window and step are all adjustable, so the radar adapts to the instrument and timeframe you are studying. It is not hardcoded to one market.
What it cannot tell you: Regime Radar characterises the current state. It does not forecast how long that state will last or what state follows it. A reading that shows rough behaviour now is a description of now, not a duration estimate.
Persistence Scanner - does today's behaviour tend to continue or reverse?
Persistence Scanner asks a different question: given the behaviour observed over the configured window, does it show persistence - a tendency for the same type of movement to continue - or anti-persistence, a tendency to reverse?
The statistical test underneath produces a score, and the surface is built with a specific constraint: when the test does not return a result the statistics support, the confidence is capped and that limitation is shown on the panel. The surface does not suppress the limitation or omit it. It displays it alongside the score, in the same panel.
This is the same design philosophy that governs Stocks Lab, a separate surface on the platform. When Stocks Lab's cointegration test fails, it labels the pair NOT COINTEGRATED and caps its confidence. The Persistence Scanner follows the same logic: state what the statistics support, cap what they do not, and show both.
What it cannot tell you: Persistence or anti-persistence is a statistical property of a window of observed data. It is not a position recommendation. The scanner scores the behaviour; what you do with that score is a separate decision.
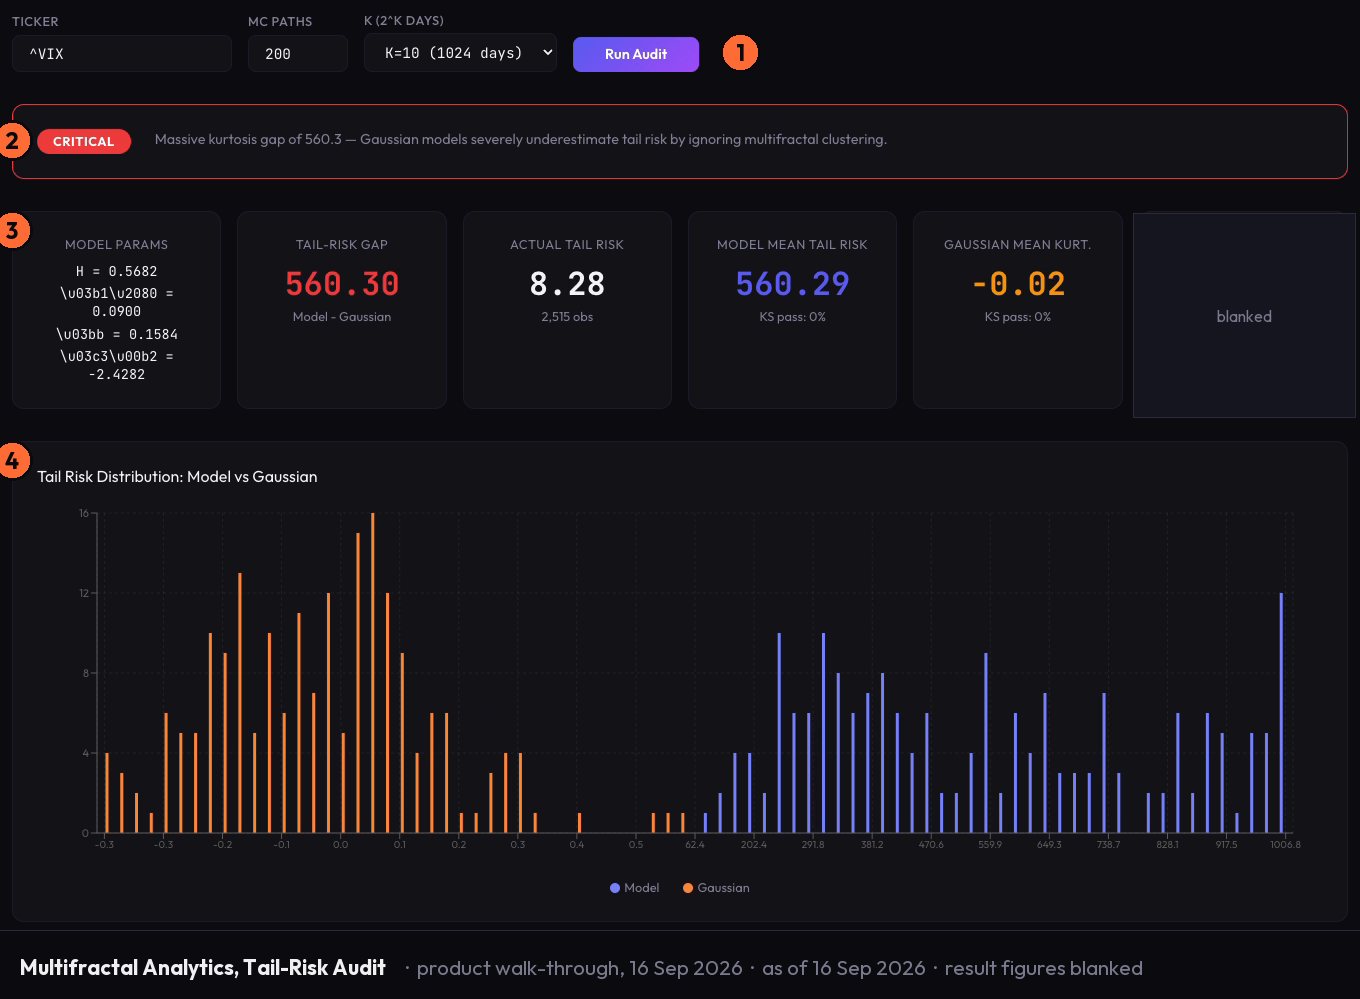
Tail-Risk Audit - what does the distribution of recent moves look like?
Tail-Risk Audit reads the tails - the distribution of recent price moves compared to what a calm, normally-behaved market would produce. A market in a rough regime generates a different distribution of returns than a smooth one. The audit surfaces that difference.
The surface labels its outputs as regime characterisation. That label is not a disclaimer added afterward. It is the output type: the audit tells you what the distribution looks like. It does not tell you what will happen next.
What it cannot confirm: the audit reads the shape of recent behaviour. It does not assign a probability to any specific outcome. A distribution that shows fat tails describes a property of the observed window; it does not predict the next move.
The limitation is the design
Each of these three sub-tools shows what it cannot confirm alongside what it can. That is not a concession. It is how the surface is built.
A measure that overstates its own confidence is less useful than one that tells you where it stops. Regime Radar, Persistence Scanner and Tail-Risk Audit each read a real property of market behaviour, and each shows you exactly where its reading ends. That boundary is as much information as the reading itself.
Multifractal Analytics is live on Vulcan Trading at the Retail tier. Start free at vulcan-trading.ai.