What Goes In
The input is not a price. It is a sequence.
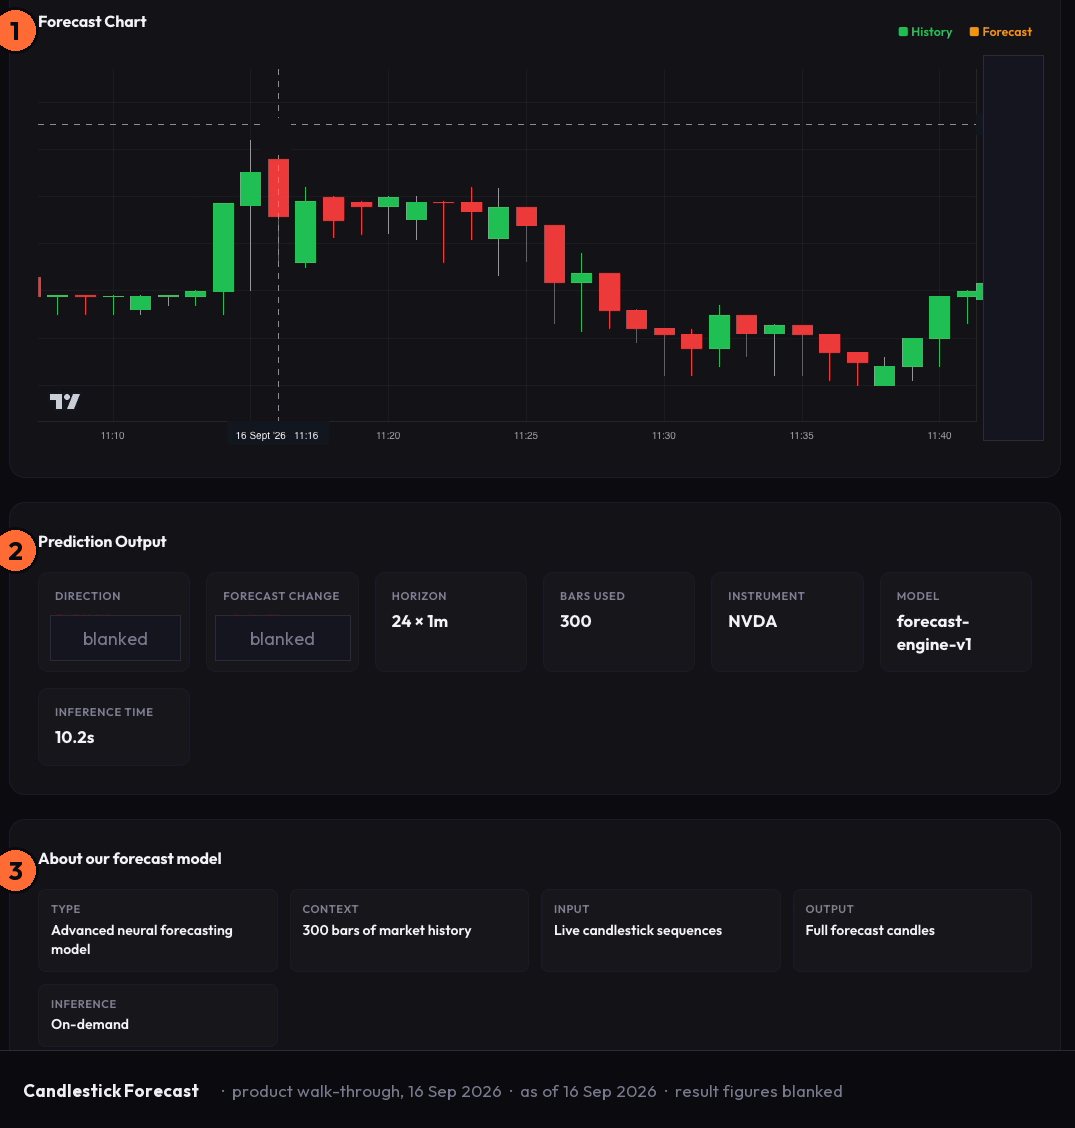
The Candlestick Forecast on Vulcan Trading reads the last 300 bars before it draws anything - open, high, low, close and volume, in order, bar by bar. That sequence is the signal. The model is looking at structure: how each bar relates to the one before it, how volume moves with price, how ranges expand and contract across the window.
This is the first distinction that separates it from an indicator. An indicator takes a price or a set of prices and applies a formula. A sequence model reads the shape of a market over time. The 300-bar context window is not a parameter chosen for convenience - it is the span the architecture needs to read the rhythm of a market before it projects forward.
What Comes Out
The output is a full candle, not a label.
At each of the three horizons - 12 bars, 24 bars and 48 bars - the model draws a projected candle body: open, high, low and close. The shape of that candle carries information that a direction label alone does not. A projected candle with a wide range and a close near the high tells you something different from a narrow-range candle closing in the middle, even if both point nominally upward. The geometry is the forecast.
Three horizons mean three explicit forward windows, not one ambiguous prediction. You can see whether the model's projected structure changes between the near term and the extended term. That difference is itself information. You set the instrument - from 27 available, spanning FX pairs, equity indices, US large-cap equities, gold and crypto - and you read the candles at each horizon before you read anything else.
Where the Model Comes From
The architecture is a decoder-only Transformer with a BSQ Tokenizer, purpose-built for OHLCV sequence modelling. It was not adapted from a language model or a general-purpose classifier. The design is specific: the model's job is to take a bar sequence and output the next bars in the same format. That specificity matters because it means the architecture was chosen for the problem, not fitted to it afterward.
The training corpus spans data from 45+ global exchanges. The model was not trained on one market or one asset class. The breadth of the corpus is what allows it to operate across FX, equities, gold and crypto from the same surface.
This model was published at AAAI 2026 - a peer-reviewed venue with a public record. You can read the methodology. Most retail tools that describe themselves as AI-powered do not offer this. The publication is not a performance claim; it is a transparency fact. The methodology is checkable, which is a different thing from the results being guaranteed.
In-product, the surface describes itself by architecture type and context window - not by an accuracy score. That framing is deliberate. It is also the honest framing.
What It Is Not
A forecast drawn against actuals is not a win rate.
The surface shows what the model projected. It does not attach a percentage to those projections. It does not show a P&L figure or imply a return. If you look at a forecast candle and then look at the bar that followed, you are seeing two data points - not a performance record. A methodology display is not a claim about what the model earns.
No accuracy figure, no win rate, no implied return appears on the surface or in this piece. The model explains the structure it reads. What you do with that explanation is your decision.
Where It Sits
The Candlestick Forecast is one surface of fifteen on Vulcan Trading. The model behind it runs that surface alone. Fourteen other engines sit behind the rest of the platform - order-book intelligence, tail-risk regime detection, Treasury curve decomposition, prediction-market flow, sentiment, and more. Breadth is the headline. The Candlestick Forecast is the entry point to a larger analytical stack, not the whole of it.
The surface is open on the Vulcan Trading free tier. Open it, set an instrument, and read the method note beside the forecast candles before you read the candles themselves. The method note is there for a reason.
Start free at vulcan-trading.ai
#TradingIntelligence #CandlestickForecast #VulcanTrading