What the surface is built on
Error Learning starts with the S&P 500 and thirty years of trading sessions. Not a summary. Not an annual average. Individual sessions, mapped to their calendar day, their day of week, their place in the trading month, and a set of regime conditions the surface defines and applies consistently.
The raw material is large. Thirty years of daily sessions across the US equity market gives you enough data to ask structural questions - not just "does this month tend to drift?" but "which specific calendar days inside this month drive that drift, and how many sessions does that conclusion rest on?"
Most seasonality tools answer the first question. Error Learning answers the second.
The cell is the unit of honesty
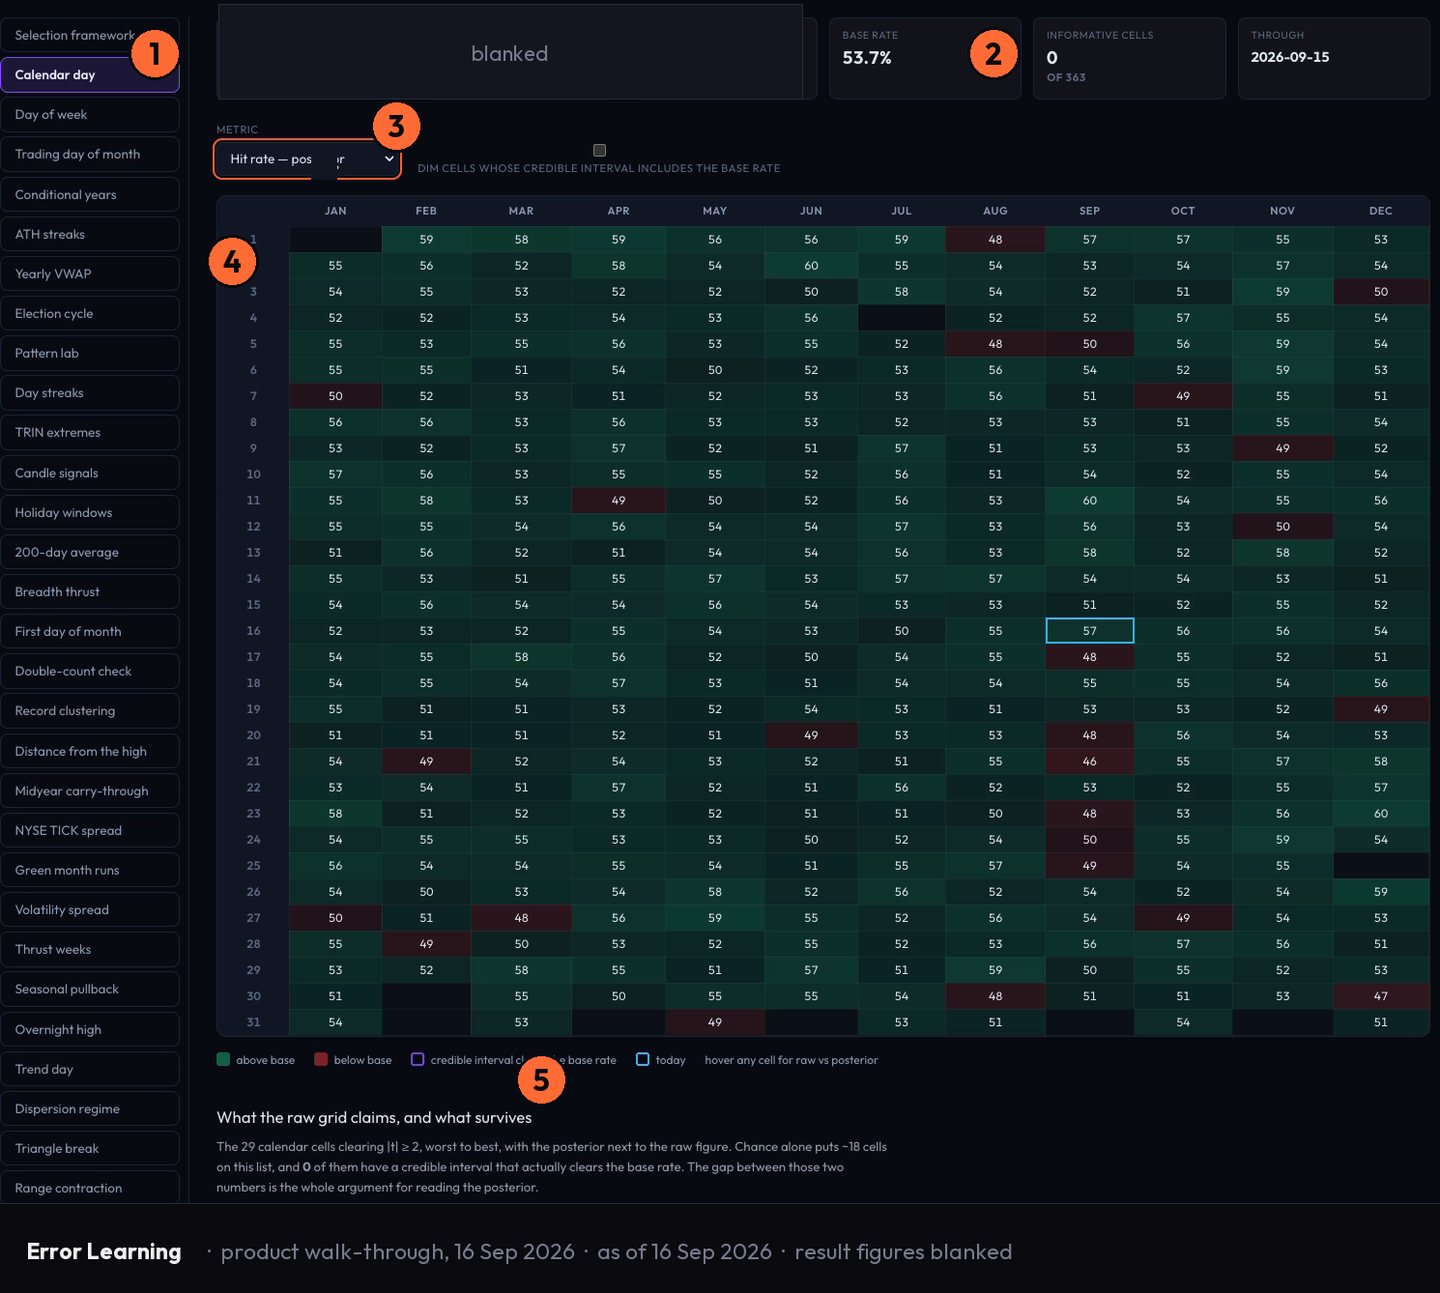
Every cell on the surface carries two pieces of information alongside whatever the historical read shows: the count of sessions behind it and the error bar around it.
This is not decoration. It is the methodology.
A cell with a large session count and a tight error bar is telling you something. A cell with a thin session count and a wide error bar is telling you something equally important - that the pattern is there in the data, but the data is thin, and the uncertainty is real. Both readings are honest. Neither hides behind the aggregate.
The surface does not smooth across cells with low sample sizes to make the picture look cleaner. It shows you the count. If you are reading a cell for a specific calendar date in a historically thin-volume period, you can see exactly how many sessions that reading rests on. If the error bar is wide, the surface is not malfunctioning - it is being precise about imprecision.
That is the discipline. Every cell earns its reading or flags that it has not.
Fourteen-plus breakdowns, one data set
The thirty years of sessions are not sliced once. Error Learning runs the same history across more than fourteen distinct breakdowns - each asking a structurally different question of the same data.
Day of week. Trading day of month. ATR regime - how the session sits inside a high- or low-volatility period, not just a calendar date. Gap behaviour: whether the session opened with a gap up, gap down or flat, and what followed. First-hour range. Session extension. Weekly seasonality.
Each breakdown produces its own cell structure. Each cell carries its own sample size and error bar. A pattern that looks reliable on the calendar-day view might fracture into noise when you cut it by ATR regime - because the apparent pattern is regime-driven, not calendar-driven, and the sample sizes in the regime slice tell you that.
This is where "sell in May" and the January effect either survive or do not. Those patterns exist in the data. Whether they survive the error bar at the breakdown level - whether the cell counts underneath them are large enough to hold the reading - is what the surface shows. Some do. Some dissolve into wide error bars on thin session counts. The surface does not tell you which to trade. It tells you which rest on enough sessions to be worth reading at all.
How to read a cell
Start with the sample size. Before you read the directional pattern, confirm the session count behind it. A reading on a date with broad session coverage and a narrow error bar is structurally different from a reading on a date with limited coverage and a wide one.
Then read the error bar as a confidence range, not a margin of error to round away. The surface puts it there because a pattern within a wide range is a weaker claim than a pattern within a tight one. Thirty years of data does not make every cell equal - the calendar is uneven, regimes cluster, and some conditions appear far less frequently than others. The error bar reflects that.
Finally, check which breakdown you are in. The same calendar date reads differently under different regime conditions. The surface keeps those cuts separate so you can compare them, not blend them.
What this piece covers - and what it does not
Error Learning has more than one panel. This piece covers the historical research output: the session data, the cell structure, the sampling discipline, the fourteen-plus breakdowns. That is the methodology, and it is what this article is built to explain.
The surface does more than the history panel. The brief for this piece scopes to the research side deliberately - and if you are reading this to understand how the underlying data is constructed and how the error bars work, that is the right starting point.
The surface is live on Vulcan Trading. The sample sizes are in the cells.
Start free at vulcan-trading.ai.