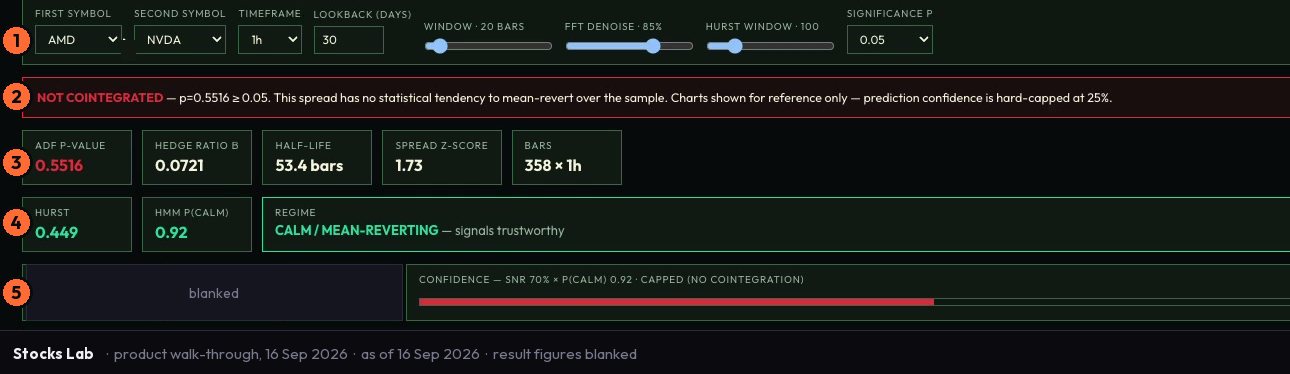
Stocks Lab is self-limiting by design. When the evidence does not support a prediction, it does not make one. It renders every cell - the p-value, the hedge ratio, the half-life, the spread z-score, the regime read, the next-hour forecast - and hard-caps its own confidence at twenty-five percent. The cap is the refusal. The charts stay on screen, marked for reference, because you still need to see what failed and why.
The gate line: ADF p-value
The first check is the Augmented Dickey-Fuller test. What it asks, in plain terms, is whether the spread between the two legs has a statistical tendency to pull back toward a mean - cointegration - or whether it wanders without that anchor. The result is a p-value. Below the threshold, the pair passes the gate. Above it, the read is NOT COINTEGRATED, and that finding propagates through every cell that follows.
A failing p-value does not mean the spread never mean-reverted in the sample. It means the test found no statistically reliable evidence that it did so consistently enough to model. That is a different thing, and the distinction matters when you are deciding whether to treat a chart as signal or as a story you told yourself.
Hedge ratio and half-life
If the pair passes, the next cells are the hedge ratio and the half-life. The hedge ratio tells you how much of the second leg to hold per unit of the first to construct a spread that is, in theory, market-neutral. The half-life tells you how long the spread has historically taken to travel halfway back to its mean - the time constant of the reversion.
Say, as an illustrative example on a synthetic series, the hedge ratio comes out at one point four and the half-life at nine days. The hedge ratio means you hold one point four units of the second leg for every unit of the first. The half-life means the spread, on this sample, took roughly nine days to close half the distance to the mean after deviating from it. A half-life of nine days is tradeable for a position you can hold across a week or two. A half-life of ninety days is a different decision entirely - the capital is tied up for a period most discretionary traders are not positioned for.
The spread itself is FFT-denoised before the z-score is computed. That is the method behind the smoothed curve you see: Fourier denoising strips the highest-frequency noise from the series so the underlying structure, if it exists, is easier to read without misreading a spike as a signal.
Spread z-score
The spread z-score measures how far the current spread sits from its historical mean, in units of standard deviation. A high positive z-score means the spread is wide; a high negative one means it has compressed. What it tells you is where the spread is relative to its own history. What it does not tell you is which direction it moves next, or when. The z-score is a location measure, not a direction call.
The regime layer
Above the spread score sit two further reads: the rolling Hurst exponent and the hidden Markov model probability of a calm regime. The Hurst exponent measures the character of the spread's recent behaviour - whether it is mean-reverting, trending, or moving in a way indistinguishable from a random walk. The HMM probability tells you whether the spread is currently in a regime where mean reversion has historically been coherent. Both sit above the spread z-score in the sequence because a z-score that looks attractive can still sit inside a regime where the spread has been trending rather than reverting.
The limits and the cap
None of these measures tell you the trade will work. They tell you the statistical conditions for the trade to be worth considering are either present or absent over the sample you are looking at. The sample is finite, the parameters are backward-looking, and regimes shift. A pair that passes every check today may not pass next month on a different window.
The NOT COINTEGRATED result with a capped confidence bar is not the tool being cautious. It is the tool refusing to dress a guess as a forecast. A spread with no statistical tendency to mean-revert over the sample cannot support a real prediction, and a confidence bar above twenty-five percent would imply it can. The cap is the honest read. The charts stay visible because the reference is still useful - you can see the spread, the p-value, the half-life, and the regime line, and decide what they mean for your view of the pair. The lab just will not pretend they add up to a signal when the gate says they do not.
Open Stocks in the Retail view, load a pair, and read the gate line first, then the hedge ratio and half-life, then the regime line - in that order, which is the order the surface runs them.