How the Study Is Built
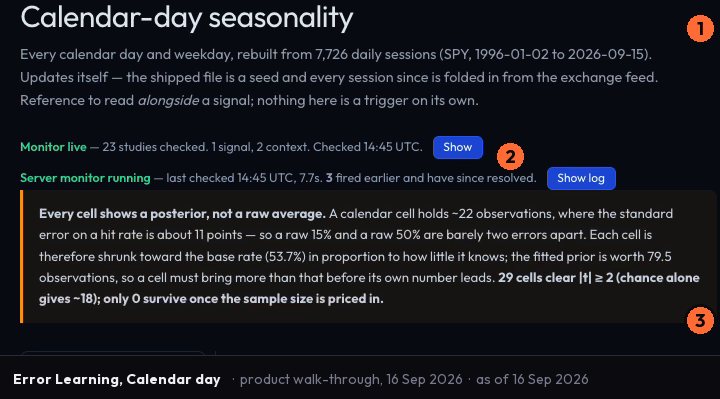
Start with thirty years of S&P 500 sessions. Take every session that falls on a given calendar date - say, the fourteenth of March across all available years. Group them. Average the outcome. Count how many observations went into that average. Measure the spread around it. Display all four: the directional read, the count, the spread, the error bar.
That is the complete construction. No proprietary scoring layer on top. No weighting by recent years. No adjustment for regime. Group, average, count, spread. The reader can audit the logic without needing to trust the output.
The error bar is not decoration. A calendar date with few observations - perhaps a date that falls on weekends often, or one near holidays - produces a wide spread. A date with many clean trading sessions produces a tighter one. The width of the bar is the honest answer to the question every seasonality chart raises and almost none answer: how much should you weight this?
Without that bar, a seasonality chart is an illustration. A date appears to be bullish or bearish based on a coloured cell. With the bar, you can see whether that colour represents a large sample with low dispersion - something worth noting - or a small sample with high dispersion - something worth ignoring. The discipline is in showing both.
The Same Logic, Fourteen-Plus Ways
Calendar date is one lens. The same construction runs across every breakdown on the surface. Day of week. Trading day of the month - the third trading day, not the third calendar day. ATR regime, separating high-volatility from low-volatility session environments. Gap behaviour. First-hour range. Session extension. Weekly seasonality.
Each breakdown applies identical logic: group sessions by the relevant variable, average the outcome, count the observations, measure the spread, show all four. The method does not change. What changes is the grouping variable.
This matters because a trader asking about Monday behaviour and a trader asking about the first trading day of the month are asking structurally different questions with the same underlying method available to answer both. The surface holds more than fourteen of these lenses. One construction, many cuts of the same thirty-year record.
What the Pattern Cannot Do
A pattern repeated across a large sample tells you what the market has tended to do under a given condition. It says nothing about what it will do the next time that condition occurs.
That distinction is not a caveat appended at the end of a seasonality study. It is structural to the method. Averaging historical sessions produces a description of the distribution, not a prediction of the next draw. The error bar makes this concrete: even a tight bar around a clear directional tendency is telling you about the past distribution, not narrowing uncertainty about tomorrow.
A study built this way - transparent count, explicit spread, auditable grouping - is more useful precisely because it does not overstate what it can deliver. You can read the cells knowing exactly how many sessions are behind each one and how widely they varied. That is what separates a statistical record from a story someone told with the same data.
Sampling Discipline as the Core Claim
Most seasonality content in trading circles skips the sample size. A chart appears, dates are coloured, conclusions are drawn. The observation count behind each cell and the spread around the average are either absent or buried. The pattern looks cleaner without them. It is also less honest.
Showing count and spread on every cell is the discipline that makes the study interrogable rather than decorative. A date that looks strongly directional with three observations behind it should read differently than the same directional read with thirty observations and a tight spread. The bar forces that reading. It is the mechanism that keeps the method from becoming the story it describes.
This is the argument for building seasonality research this way. Not that the pattern will repeat. That you can see exactly how much history is behind each cell, how consistent that history has been, and make your own assessment of how much weight it deserves.
Thirty Years of Sessions, Every Cell Accounted For
Error Learning is live on Vulcan Trading. Thirty years of S&P 500 sessions, organised by calendar day and across every other breakdown the surface carries, with every cell showing its own count and spread. It is one surface of fifteen on the platform - alongside Order Flow Intelligence, Tail-Risk Analytics, Stocks Lab, and the rest of the quant runtime.
The method is open. The construction is auditable. The sessions are counted.
vulcan-trading.ai