A move has run for three sessions. You are watching the candles and trying to read whether this is the kind of move that keeps going or the kind that snaps back. The candles do not answer that question. They describe what happened.
The Hurst exponent gives you a different read. Not the direction - the character. Whether the series, over the window you measured, has been the kind that continues or the kind that reverses.
How the measure works
The exponent - written as H - sits on a scale from zero to one. The midpoint, one half, is the reference case: a series at one half has been behaving like a random walk. Consecutive moves have no tendency to continue or reverse. Past direction carries no information about future direction. The series has been doing what a fair coin toss would do.
Move H toward one and the character changes. The series has been persistent - moves in one direction have tended to follow moves in that same direction. Upward moves have tended to be followed by more upward moves. The series has had memory, in a statistical sense, over the sample you gave it.
Move H toward zero and the character reverses. The series has been mean-reverting - moves have tended to be followed by moves in the opposite direction. Rises have pulled back. Falls have recovered. The series has been oscillating rather than trending.
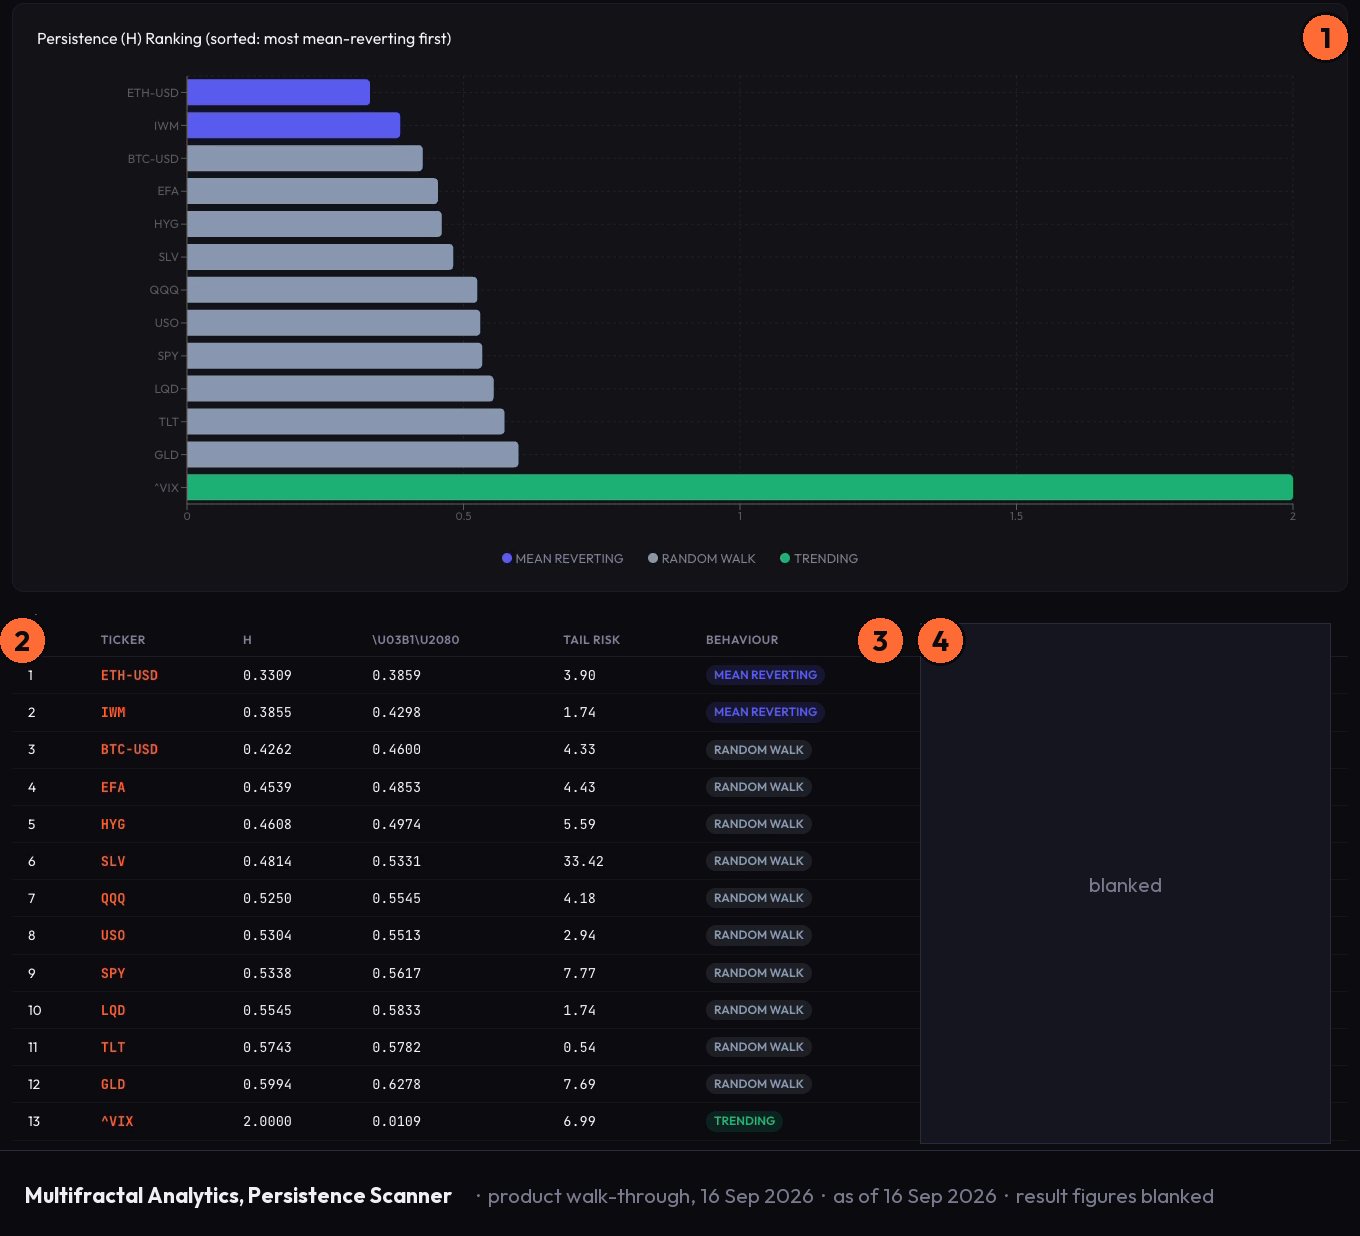
The Persistence Scanner in Multifractal Analytics shows you H per instrument alongside its behaviour label - the plain-language translation of where that number sits on the scale. Read the label first. Then the number that produced it. They carry the same information in two registers, and the label is there because a number alone requires you to do the translation yourself every time.
The surface states its sample, its window and its step beside every H value. That statement is not a footnote. It is part of the read. An H value calculated over a short, recent window describes a short, recent period. The same instrument over a longer window may produce a different result, because the character of a series changes over time.
A worked example
Say you are looking at a synthetic series you have labelled Series A - this is an illustrative example only, not a live instrument read. Say the scanner returns an H of zero point seven two, and the behaviour label reads persistent. That tells you that over the sample the scanner measured, Series A has shown a tendency for moves to continue. Consecutive returns have pointed in the same direction more often than a random walk would predict. The series has had the statistical signature of a trending market over that window.
Now say a second synthetic series, Series B, returns an H of zero point three one, labelled mean-reverting. Over its sample, moves have tended to reverse. The series has oscillated. A momentum-based reading of Series B's last three candles would be pulling in the wrong direction for the character that H describes.
The point of the example is not the numbers. It is that the same three-session move means something different in a series labelled persistent than it does in a series labelled mean-reverting. The exponent tells you which frame applies.
What the exponent cannot tell you
H describes the past sample. It does not forecast the next bar, and it does not tell you that the character of the series will hold. Persistence in the window you measured is a fact about that window. What the series does after the window closes is a separate question - one the measure does not answer.
The objection that follows from this is direct: if the scanner says the series has been trending, can you ride the trend? No - not on the basis of H alone. The exponent tells you what the series has been doing. A persistent series can stop being persistent. A mean-reverting series can break into a trend. H gives you the regime that the sample supports; it does not promise the regime continues.
That distinction matters because momentum logic and mean-reversion logic are not interchangeable. Knowing which one the series has been consistent with over the measured window shapes how you read every other signal against it - entry, sizing, the expected character of a pullback. The exponent earns its place as context, not as instruction.
None of the three panels in Multifractal Analytics caps a confidence figure. Regime Radar, Persistence Scanner and Tail-Risk Audit each state their sample, window and step instead, because the conditions of the measurement are inseparable from what the measurement means. A number without its measurement conditions is incomplete. The surface does not let you forget the conditions.
Open Multifractal Analytics, choose Persistence Scanner, and read the H value and the behaviour label beside each name you watch.