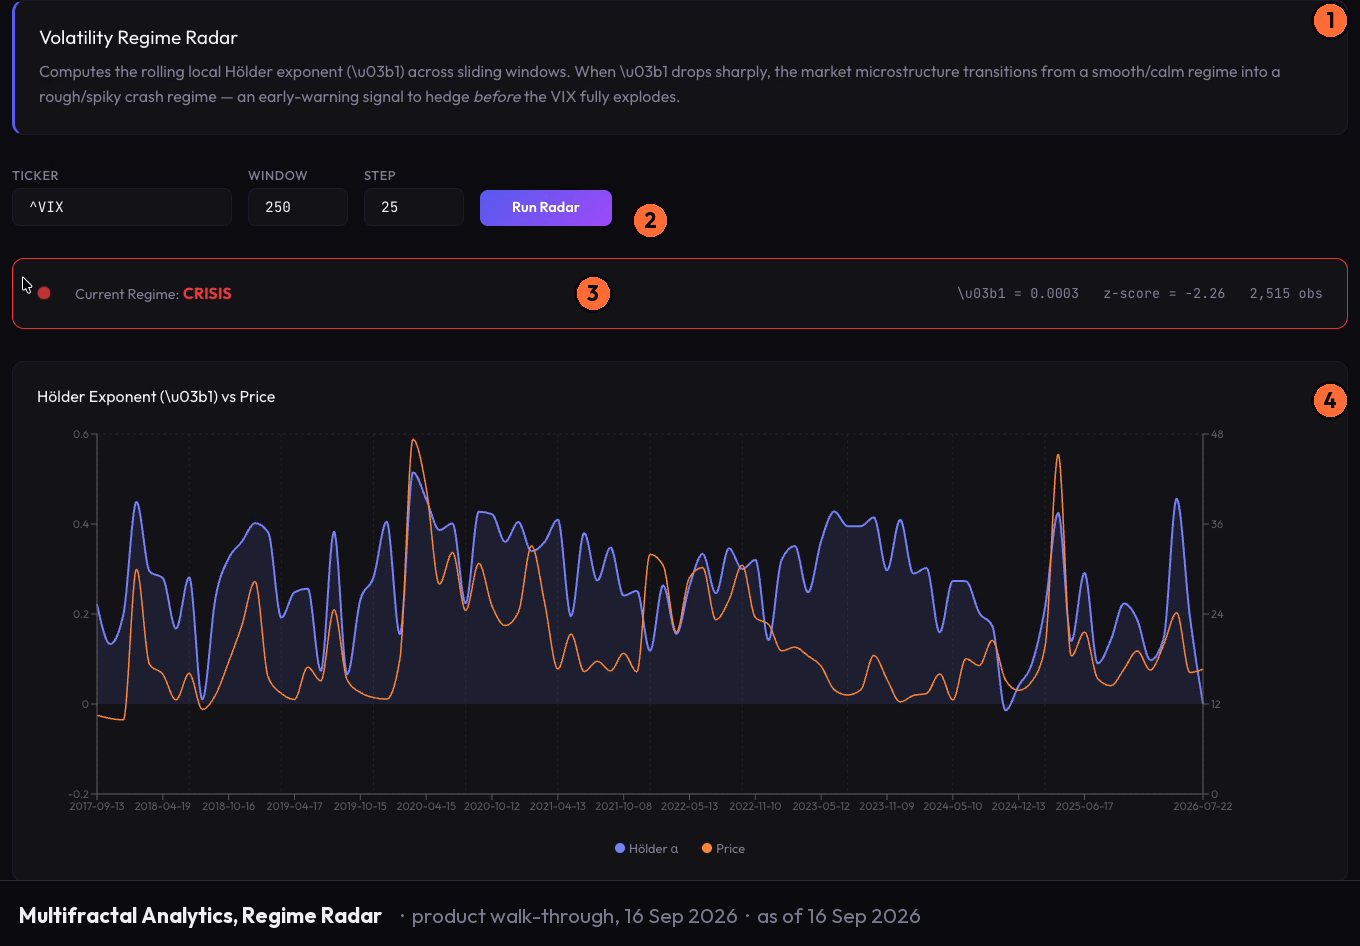
The tape feels different this week. Same instruments, same hours, same setup - but every entry is getting run through before it has a chance to breathe.
You cannot point at a number that says why. Volatility is not obviously higher. The news flow is unremarkable. The market has not broken in any clean direction. It has just changed character, and you are feeling it in your P&L before any measure has named it.
That gap - between a market changing character and a measure catching up - is exactly what the Hölder exponent is designed to close.
Volatility is not roughness
Volatility tells you how far prices moved over a period. Roughness tells you how they moved - whether the path between those prices was smooth and drifting in one direction, or spiky and self-correcting, reversing inside the bar before it had a chance to resolve. The two measures can rise and fall independently. A market can become rougher without becoming more volatile in the conventional sense, and that is often what early regime change looks like: the character changes before the amplitude does.
The Hölder exponent is the measure that tracks roughness. A value approaching one describes a path that is nearly smooth - trending, persistent, carrying momentum forward. A value approaching zero describes a path that is almost nowhere differentiable - reversing sharply, self-interrupting, with no sustained direction inside any short window. Most price series sit somewhere between the two, and the exponent moves through time rather than returning a single number for the whole history. That locality is what makes it sensitive to transitions rather than averages.
A regime change, in this frame, is a shift in the exponent - not a spike in a downstream statistic after the fact, but a change in how the series is moving right now.
What the surface shows
On Regime Radar - one of the three panels on Multifractal Analytics - you see the exponent track rolling across the window you choose, with the ticker, window and step all displayed and configurable. The window is the decision the reader makes before reading the surface: a short window is responsive and noisy, a longer window is smoother but slower to turn. Neither is wrong. The exponent you read reflects the window you chose, and the surface says so.
To make this concrete: say you are watching a series where the exponent has been sitting steadily above midpoint for several weeks, which would be characteristic of a calm, trending regime. Then, over several sessions, it begins shifting - not in a single jump, but in a progressive drift toward a lower value, suggesting the path is becoming rougher and less persistent. The regime label on the surface changes to reflect what the exponent now shows. That is a synthetic example with illustrative values - but it describes the kind of transition the panel is built to surface, and why reading the exponent track alongside the label tells you more than either does alone. The label names the regime; the track shows you how the surface arrived at it.
Regime Radar does not tell you what to do in a rough regime. That is not its job.
What the measure cannot tell you
The exponent describes character. It does not predict direction. A rough regime tells you that the series is self-interrupting at short intervals - it does not tell you whether the next move is up or down, or how long the roughness lasts before it resolves. The window you choose governs what the measure can see, and a short window will register transitions earlier but will also respond to noise that a longer window would absorb. There is no setting that is universally correct; the right window depends on the time horizon you are trading.
The two other panels on the same surface extend the picture. Persistence Scanner reads Hurst H per instrument over a stated sample and attaches a behaviour label - it answers a related question at a different time scale. Tail-Risk Audit compares observed tails against a Gaussian baseline and runs Monte Carlo paths - it shows what a rough regime looks like in the distribution rather than in the path alone. All three panels state their sample, window and step. None of them caps a confidence figure. What they give you is method and context, not a position.
The technique has a non-financial lineage: the multifractal market model applies tools developed for aerodynamics and wind turbulence - drawn from the surface founder's PhD work - to market roughness. That origin matters because it means the method was not fitted to market data to produce a result; it was fitted to a physical phenomenon that shares the mathematical structure of price series.
Open Multifractal Analytics, choose Regime Radar, and read the current regime label and the exponent track together over the last few weeks. The label names what the surface sees; the track shows you whether the character has been shifting, and how long it has been doing so.