You have two stocks that have moved together for months. The spread has opened. Every instinct says it closes, and you are about to act on the chart alone.
That is the moment the test exists for.
What the spread actually tells you
The spread is the difference between the two prices, adjusted for how much of one you hold against the other. That adjustment - the hedge ratio - is not something you eyeball. It comes from regressing one price series on the other, so that the resulting spread is as stationary as the data allows. A stationary spread is one that wanders around a stable mean rather than drifting away from it indefinitely. If the spread is stationary, the pair has a structural tie. If it is not, you have two stocks that happened to trend together for a period, and the spread can keep widening without any force pulling it back.
The chart cannot tell you which of those is true. It shows you what happened. The ADF test - the Augmented Dickey-Fuller test - asks whether the spread's behaviour is consistent with mean reversion or with a random walk. That is the gate, and on Stocks Lab it is the first thing the engine runs.
The sequential read
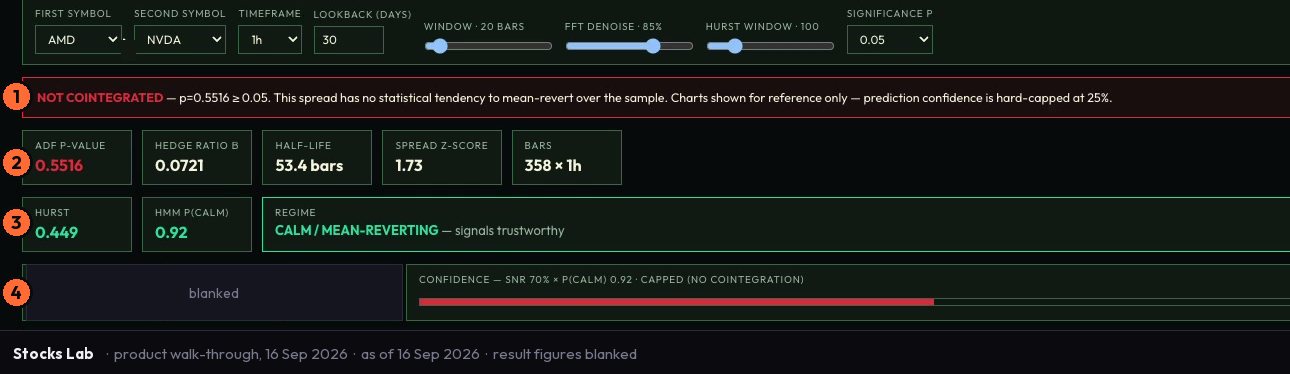
The four outputs on Stocks Lab are not parallel reads you weigh against each other. They are sequential. The ADF p-value comes first. If it does not clear the threshold, the hedge ratio that follows it is not actionable, the half-life calculated from the hedge ratio is not meaningful, and the spread z-score derived from both is not a signal. Each step depends on the one before it, and the p-value is the foundation.
A low p-value says the data are inconsistent with a random walk - that is, the spread shows evidence of mean reversion. A high p-value says the opposite. The threshold is conventional, not arbitrary: it reflects how much evidence you need before treating the spread as structural rather than coincidental.
A worked example on a synthetic pair
Say you run the test on two names you have been watching and the hedge ratio comes out at one point four - meaning you hold one point four units of the second stock for every unit of the first - and the half-life comes out at nine days. Both numbers are illustrative; this is a synthetic pair, not a product read. The hedge ratio tells you the position structure that produces the most stationary spread the data can yield. The half-life tells you how long the model expects the spread to take to revert halfway to its mean, given the cointegration relationship it found. Nine days is the expected reversion window under the model's assumptions - it is not a forecast, and it is not a guarantee. If the p-value does not clear the gate, neither of those numbers is reached, because they have no valid foundation to rest on.
Downstream of the cointegration result, Stocks Lab applies FFT denoising to the spread and produces a one-step-ahead forecast. The HMM regime layer - rolling Hurst exponent and a hidden Markov model estimating the probability of a calm regime - contextualises whether the pair's reversion behaviour is likely to hold in the current market state. None of that is reached if the pair fails the first test.
When the surface refuses to answer
When the cointegration test fails, Stocks Lab does not present a hedged result with a low confidence score that you can choose to act on anyway. It displays NOT COINTEGRATED and caps its own confidence at twenty-five percent. The cap is not a caveat appended to a signal. It is the signal. The surface is telling you that past that point, the test is not giving you anything useful - and acting on the chart alone is the trade you were about to make before you ran it.
That refusal is the methodology. Every live strategy on the broader platform runs against a mirror, and losing strategies stay on screen. Stocks Lab applies the same logic to the test itself: when the statistics do not support confidence, the surface says so explicitly rather than letting a number carry more weight than it earned.
The chart shows the move. The test tells you whether it has to come back.
Correlation is not cointegration. Correlation describes the past. Cointegration is the structural test - and two prices can be highly correlated for a year and still fail it.
Open Stocks in the Retail view, pick any two names you watch, and read the cointegration line before you look at the spread chart.