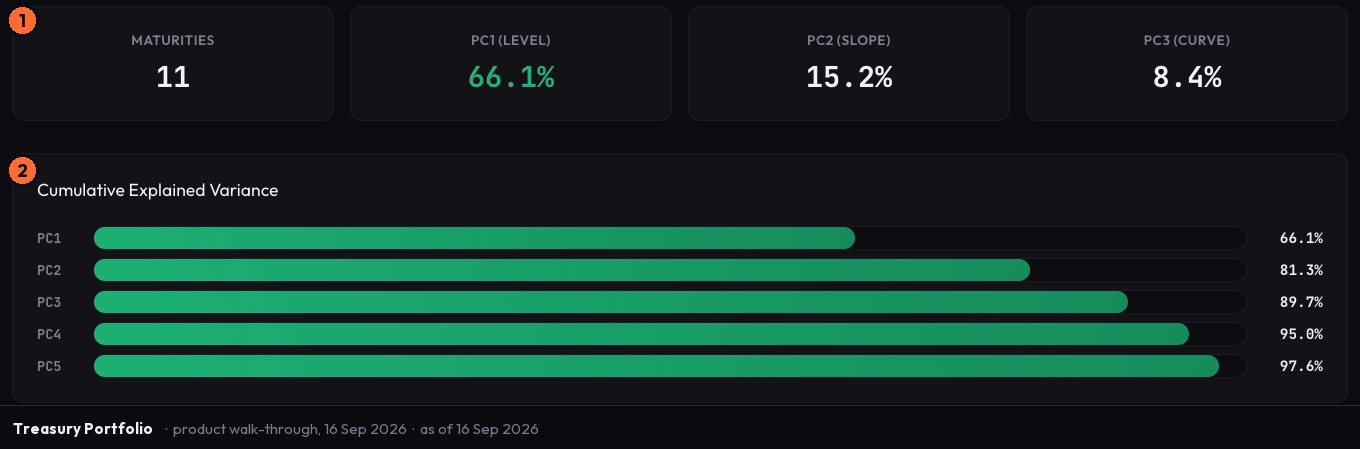
Principal component analysis turns that list into three movements. Level, slope and curvature are what the covariance structure of rates returns produces when you let the data speak - not simplifications invented for convenience, but the actual shapes that explain most of what a yield curve does over time. The loading table on Treasury Portfolio translates them into numbers you can check maturity by maturity.
What each factor is
Level is the simplest to read. When the level factor moves, all maturities move together - same direction, roughly similar size. A rate shock that lifts the entire curve from one month out to thirty years is a level move. In the loading table, a high positive loading across every maturity row tells you that maturity participates fully in that shift.
Slope is the factor most people picture when they say "the curve steepened." Short maturities and long maturities move in opposite directions. When the two-year falls and the ten-year rises, that is a slope move. In the loading table, short-end maturities carry loadings of one sign and long-end maturities carry loadings of the other. The magnitude tells you how much each point on the curve participates. A maturity near the middle of the loading table - where the sign changes - barely moves with slope at all.
Curvature is the factor that bends the middle relative to both ends. Short and long maturities move in one direction; intermediate maturities move in the opposite direction. A curve that flattens at both ends while the belly rises, or vice versa, is being driven by curvature. In the loading table, you see a pattern where the middle maturities carry loadings of opposite sign to the tails.
These three factors account for the large majority of historical yield curve variance. The fourth factor explains considerably less, and each subsequent one less still. That is not a claim about what the curve will do next - it is a description of how it has moved historically, which is what the decomposition shows.
Reading the loading table
Say the factor-loading table for the slope factor shows a loading of minus zero point six at the one-year maturity and plus zero point eight at the thirty-year maturity - this is an illustrative example, not a surface read. What that tells you is that when the slope factor shifts, the one-year tends to move down and the thirty-year tends to move up, with the thirty-year participating more. If your book is long at the one-year and short at the thirty-year, you are positioned in the direction a slope flattening favours. If it is the reverse, you are positioned for steepening. The loading table is how you see that in a single row rather than in a list of maturities.
Treasury Portfolio on Vulcan Trading runs this decomposition across eleven maturities from one month to thirty years on the US Treasury curve, with a selectable history of one, two, five or ten years. Changing the history length changes which covariance structure the decomposition describes - a five-year window includes the rate cycle of those five years, and a two-year window emphasises more recent behaviour. Neither is more correct. They describe different periods, and the loadings shift accordingly.
What the decomposition does not tell you
PCA describes historical co-movement. It does not forecast whether the curve will steepen, flatten or twist from here. If you ask Treasury Portfolio which factor is about to move, the surface has no answer, because that is not the question a decomposition can answer. What it can tell you is how each maturity in your book has co-moved with each factor over the history you selected - and therefore where your exposure sits if that factor moves again.
That distinction matters. A loading table is a description of structure, not a recommendation. The surface names what it knows - historical factor loadings, variance explained, co-movement - and stops there. It does not tell you which factor to position for, and it would be wrong to present it as though it did.
The limits are also methodological. PCA on a historical window assumes the covariance structure is reasonably stable over that window. In periods where the curve behaves differently from its own history - a regime shift, a policy discontinuity - the loadings describe a structure that may no longer hold. The decomposition will still run. The interpretation requires more care.
Open Treasury Portfolio, pick a history length, and read the loading table row for the maturity you hold most of.