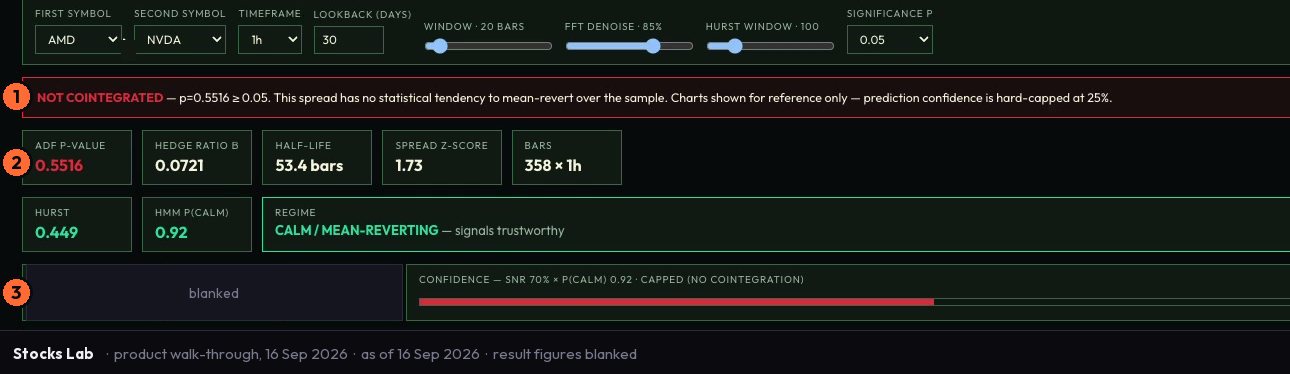
The pair passed the test. The spread is wide, the position is on, and a week has gone by. You are sitting in a trade that statistically should be closing, and it is not. You are wondering whether you were early or wrong.
That question has a sharper version: did you read both numbers before you put it on?
What the ADF test is actually asking
The augmented Dickey-Fuller test runs a formal check on whether the spread between two instruments behaves like a random walk or like something that pulls back toward a mean. A low p-value - the ADF p-value Stocks Lab surfaces on every pair - is a statement that the spread is not drifting without bound. It returns. That is all it says.
It does not say when. It does not say how many times the spread will widen further before it closes. A passed test is a yes to one question: is this relationship statistically real? The follow-up question - can you hold through it? - the ADF p-value cannot answer.
Most pairs trades that fail do not fail because the test was wrong. They fail because the holding period runs out before the spread does.
What the half-life is asking instead
Half-life is the estimated time it takes for the spread to close half the distance between its current level and its long-run mean. Stocks Lab computes it alongside the ADF p-value, the hedge ratio and the spread z-score, and it is the number that converts a statistical result into a practical decision.
A short half-life means the spread tends to close quickly. The reversion is fast enough to sit inside a real holding period, with margin, carry and patience all still manageable. A long half-life means the opposite: the spread may well return, but you are paying every day it does not - in financing, in margin that could be elsewhere, in the opportunity cost of capital tied to a trade that has not moved.
That is the correct answer to "if the spread mean-reverts, why does it matter how fast?" Because you pay to wait. A few days and a few months describe the same statistical truth and two very different trades. One you can hold through. One eats you before it pays.
A worked example on a labelled pair
Say you are looking at a synthetic pair - call it Pair A, constructed from two large-cap US equities for illustration purposes only. The hedge ratio comes out at one point four and the half-life at nine days. The ADF p-value is below the standard threshold. On those numbers, the pair qualifies: the spread is real, the reversion is fast enough to sit inside a two-week holding window, and the hedge ratio tells you how much of one leg to run against the other. You can now ask a useful question: if the half-life were eighteen days instead of nine, would you still want it? At twice the half-life, financing costs double, the position stays open longer through any further widening, and the edge that looked clean at nine days starts to look marginal. That is the question Stocks Lab is built to let you ask before you fund the trade, not after.
What neither number can tell you
A low p-value and a short half-life mean the relationship was stable over the period the model trained on. They do not mean it will stay stable. Regime shifts - changes in correlation driven by sector rotation, earnings, macro events - can break a cointegrated pair without warning, and neither statistic gives you advance notice.
The z-score tells you where the spread is relative to its own history. It does not tell you the relationship still holds at the level the test measured it.
This is why Stocks Lab's self-limiting behaviour matters as much as its outputs. When a pair fails the cointegration test, the surface does not return a softened result or a lower confidence figure. It returns NOT COINTEGRATED and caps the confidence reading at its floor. That is not a failure state. It is the model declining to answer a question the data cannot support - which is the correct answer. A tool that tells you "not enough to work with" on a failed test is doing something harder than returning a number, and more useful.
What to do next
In Stocks, read the ADF p-value and the half-life on the same pair and ask whether you would still want it at twice that half-life. If the answer is no, the test passed and the trade did not.